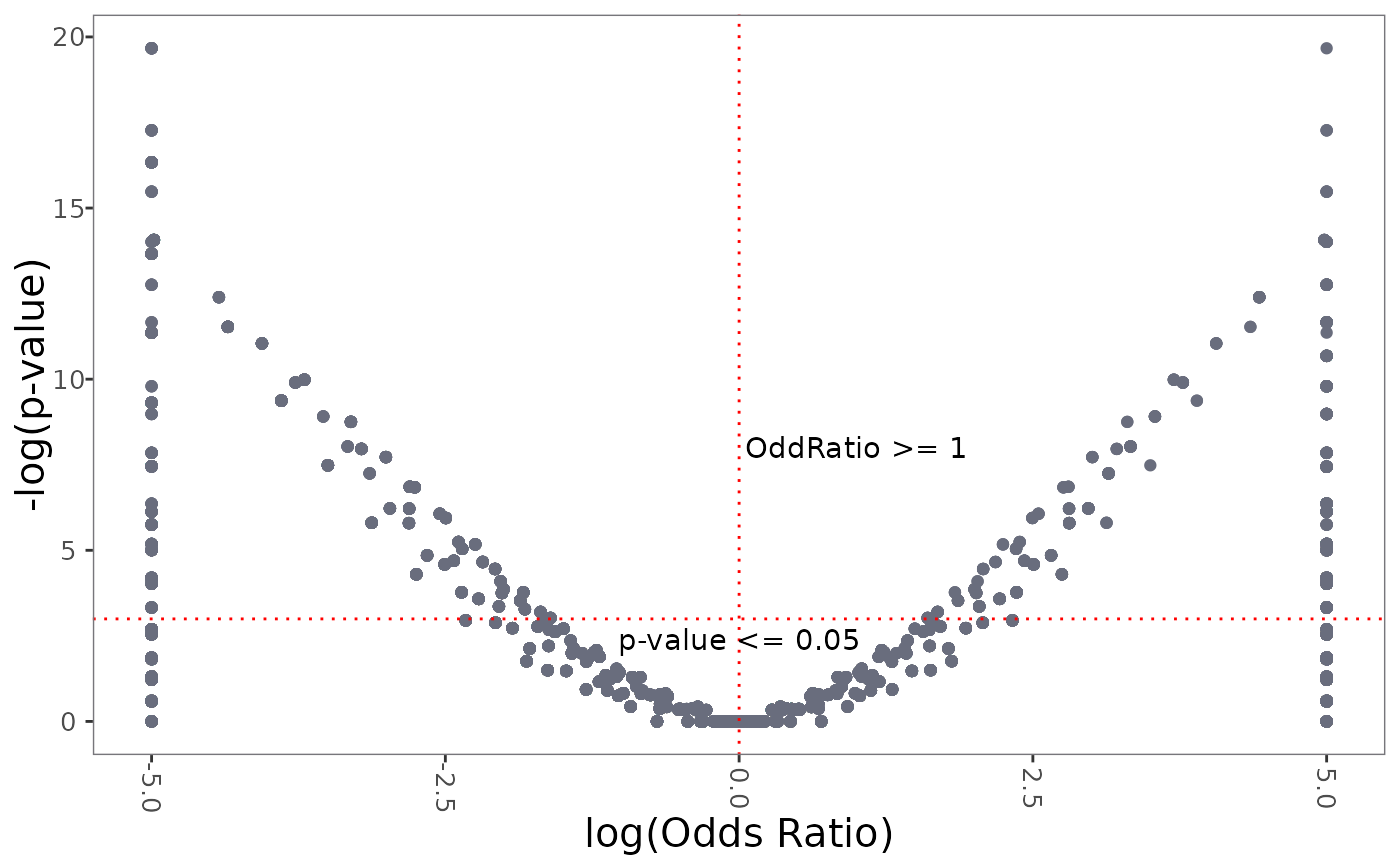
This function plots a volcano plot for GeneDiscoveR analysis results.
With the formula("first_phenotype ~ second_phenotype"),
The volcano plot for odds ratio > 1 represent the orthogroups enriched with genes from species with the first phenotype.
In contrast, the volcano plot for odds ratio < 1 represent the orthogroups enriched with genes from species with the second phenotype.
plot_genediscover_volcano(GeneDiscoveRobject = NULL, name = NULL)Arguments
- GeneDiscoveRobject
An object of class 'GeneDiscoveR' containing the analysis results.
- name
The name of the analysis to plot.
Value
A ggplot object representing the volcano plot.
Examples
# Create a GeneDiscoveR object
N0sDir <- system.file("extdata", "N0-1dot3-6", package = "GeneDiscoveR")
overallsDir <- system.file("extdata", "Comparatives-1dot3-6", package = "GeneDiscoveR")
dataFile <- system.file("extdata", "annotatedCDSs.tsv", package = "GeneDiscoveR")
minInflation <- 1.3
maxInflation <- 6
stepInflation <- 0.1

GeneDiscoveRobject <- GeneDiscoveR(overallsDir = overallsDir, N0sDir = N0sDir, dataFile = dataFile, minInflation = minInflation, maxInflation = maxInflation, stepInflation = stepInflation)

# Set active run
GeneDiscoveRobject <- set_run_active(GeneDiscoveRobject, InflationValue = 1.8)
#> -----------From OrthoFinder-----------
#> The process has been completed successfully

# Select species by phenotype
GeneDiscoveRobject <- select_species_by_phenotype(GeneDiscoveRobject = GeneDiscoveRobject, columnPhenotype = "Oil-body-type", columnID = "OrthofinderID", type = "one_in_specialized_cell")
GeneDiscoveRobject <- select_species_by_phenotype(GeneDiscoveRobject = GeneDiscoveRobject, columnPhenotype = "Oil-body-type", columnID = "OrthofinderID", type = "many_in_all_cells")

# Gene identification by phenotype
GeneDiscoveRobject <- gene_identification_by_phenotype(GeneDiscoveRobject = GeneDiscoveRobject, formula = as.formula("one_in_specialized_cell ~ many_in_all_cells"), statistic = "Fisher", name = "PerOBtype", cores = 8)

# Volcano plot
plot <- plot_genediscover_volcano(GeneDiscoveRobject, name = "PerOBtype")
# Output: A ggplot object representing the volcano plot.
plot