Plot all species OGs and sOGs per inflation
Source:R/01_runs_statistics.R
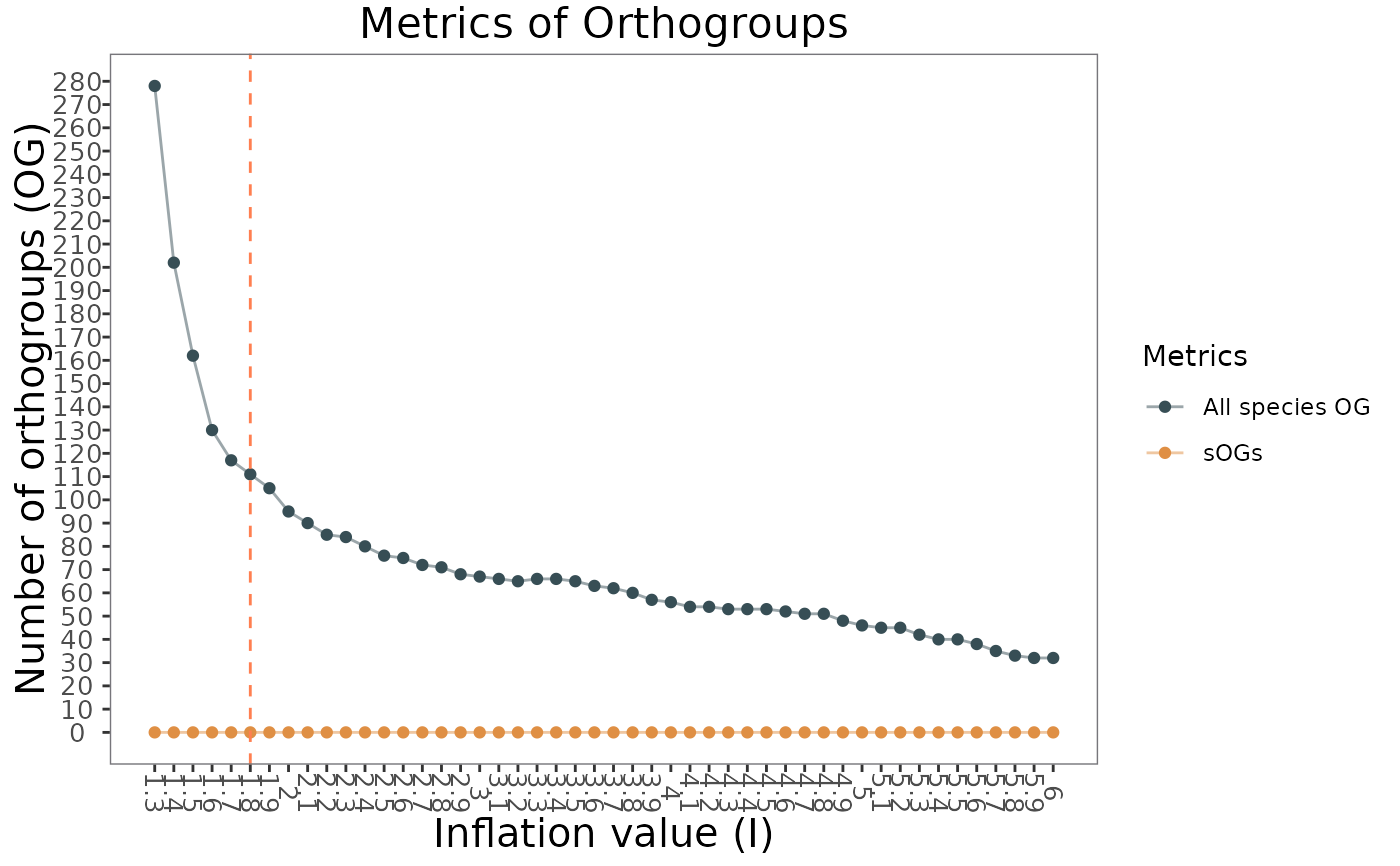
plot_allSpeciesOGs_sOGs_per_inflation.RdThis function plots the all species OGs and sOGs per inflation. If a run is active, a vertical dashed line is added to the plot on the active run's inflation value. The function is only for executions with multiple inflation values.
plot_allSpeciesOGs_sOGs_per_inflation(GeneDiscoveRobject = NULL)Arguments
- GeneDiscoveRobject
An object of class "GeneDiscoveR" containing the necessary data for plotting.
Value
An object of class "ggplot" representing the plot.
Examples
# Create a GeneDiscoveR object
N0sDir <- system.file("extdata", "N0-1dot3-6", package = "GeneDiscoveR")
overallsDir <- system.file("extdata", "Comparatives-1dot3-6", package = "GeneDiscoveR")
dataFile <- system.file("extdata", "annotatedCDSs.tsv", package = "GeneDiscoveR")
minInflation <- 1.3
maxInflation <- 6
stepInflation <- 0.1
GeneDiscoveRobject <- GeneDiscoveR(overallsDir = overallsDir, N0sDir = N0sDir, dataFile = dataFile, minInflation = minInflation, maxInflation = maxInflation, stepInflation = stepInflation)
# Calculate overall statistics
GeneDiscoveRobject <- calculate_overall_statistics(GeneDiscoveRobject, cores = 8)
# Plot all species OGs and sOGs per inflation
plot_allSpeciesOGs_sOGs_per_inflation(GeneDiscoveRobject)
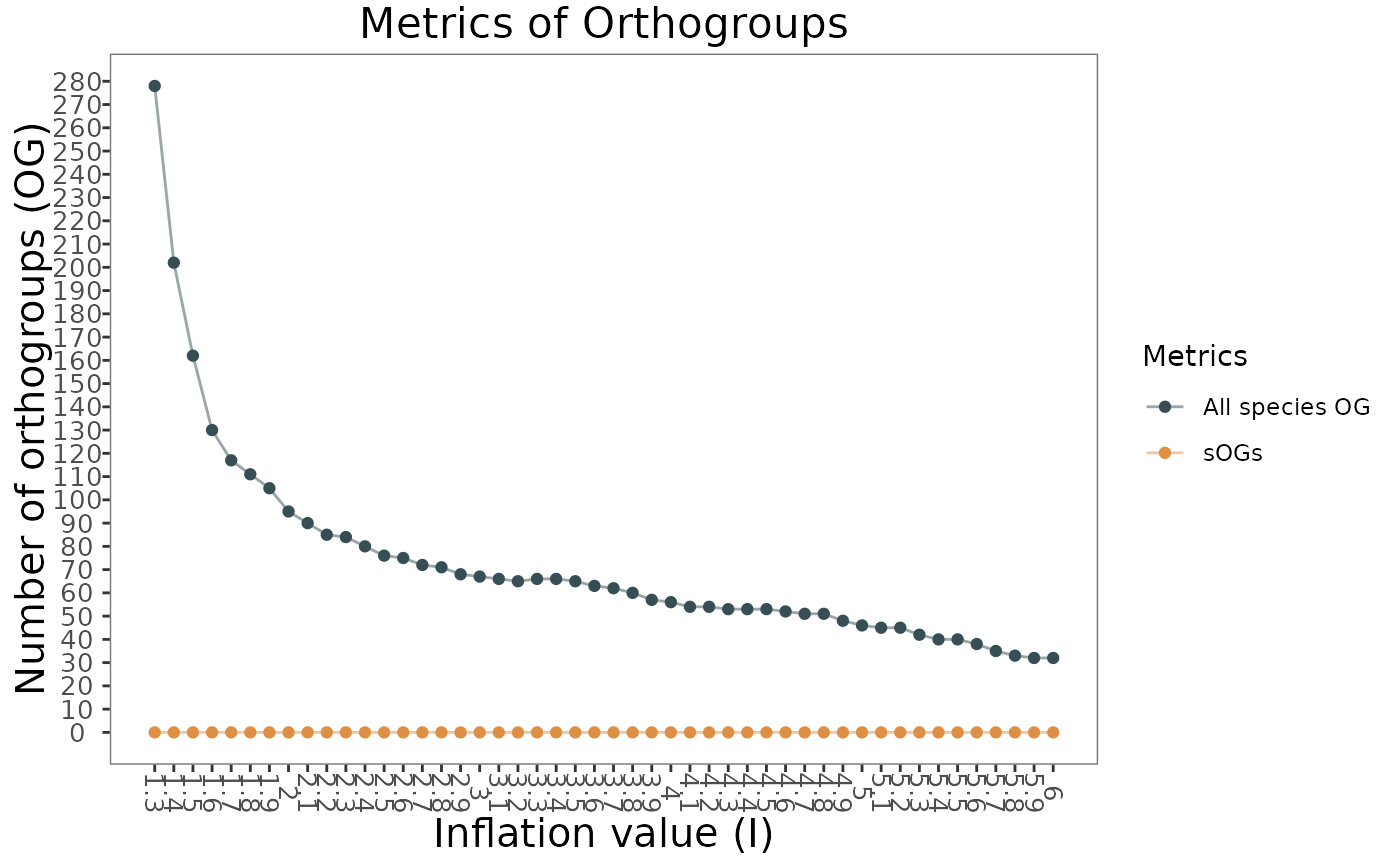 # Plot all species OGs and sOGs per inflation with active run
GeneDiscoveRobject <- set_run_active(GeneDiscoveRobject, InflationValue = 1.8)
#> -----------From OrthoFinder-----------
#> The process has been completed successfully
plot_allSpeciesOGs_sOGs_per_inflation(GeneDiscoveRobject)
# Plot all species OGs and sOGs per inflation with active run
GeneDiscoveRobject <- set_run_active(GeneDiscoveRobject, InflationValue = 1.8)
#> -----------From OrthoFinder-----------
#> The process has been completed successfully
plot_allSpeciesOGs_sOGs_per_inflation(GeneDiscoveRobject)